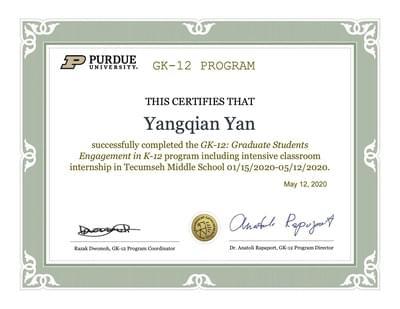
Purdue GK-12 Program/Visiting Tecumseh Junior High School
A brief introduction of the GK-12 program:
The GK-12 provided an opportunity for graduate students and post-docs an opportunity to learn, practice, and gain teaching experience. On the one hand, you meet with a Professor from College of Education and his students during the workshops. Here is a typical schedule for the meetings (A slight change due to COVID19)
- January 17 (Friday) Workshop #1
- January 22 (Wednesday) Teacher/Participant Meet & Greet
- January 31 (Friday) Workshop #2
- Feb 14 (Friday) Workshop #3
- April 3 (Friday) Workshop #4
- May 1 (Friday) Final Meeting
On the other hand, you team up with a teacher from Tecumseh Junior High school for a day each week. As time goes by, you gradually change from a observer to a leader in the class. You are supposed to take over the entire class in the end. At the end, you would eventually obtain a certificate.

My course design
I eventually designed a class about temperature conversion. Download the slides here. Students just learned linear equations, dilations, translations, finding intersections of two lines, etc. The video below illustrates the presentation in a very fast pace
Based on a few data points, students need to draw the points on the provided graph, figure out the relation by themselves, solve a problem using equations.
A bit more details
Students will be able to convert temperature between Fahrenheit, Celsius and Kelvin. Students will be able to learn to apply their knowledge they just learned from linear equations and graph techniques. Students will also deepen their knowledge of transformation of 2D graphs.
In this lesson I introduce students to temperature scales and unit conversions using equations. Most students know the common sense meaning of the temperature. My goal is to build on this knowledge, introduce the idea of unit, including Celsius, Fahrenheit, and Kelvin and help them convert between the scales. I would start by plotting one over the other and let the students guess the underlying relationship. The students should be able to convert a graph to a linear equation. Then I would introduce the formula to covert back. I would then use translation and dilation, of which the students just learned, to help them understand it. This lesson aligns with following Indiana Standards of Grade 8:
- PS.1: Make sense of problems and persevere in solving them.
- PS.2: Reason abstractly and quantitatively.
- PS.3: Construct viable arguments and critique the reasoning of others.
- PS.4: Model with mathematics.
- PS.5: Use appropriate tools strategically.
- PS.6: Attend to precision.
- 8.C.1: Solve real-world problems with rational numbers by using multiple operations.
- 8.AF.1: Solve linear equations with rational number coefficients fluently, including equations whose solutions require expanding expressions using the distributive property and collecting like terms. Represent real-world problems using linear equations and inequalities in one variable and solve such problems.
- 8.AF.5: Interpret the equation y = mx + b as defining a linear function, whose graph is a straight line; give examples of functions that are not linear. Describe similarities and differences between linear and nonlinear functions from tables, graphs, verbal descriptions, and equations.
- 8.AF.8: Understand that solutions to a system of two linear equations correspond to points of intersection of their graphs because points of intersection satisfy both equations simultaneously. Approximate the solution of a system of equations by graphing and interpreting the reasonableness of the approximation.
- 8.GM.3: Verify experimentally the properties of rotations, reflections, and translations, including: lines are mapped to lines, and line segments to line segments of the same length; angles are mapped to angles of the same measure; and parallel lines are mapped to parallel lines.
- 8.GM.6: Describe the effect of dilations, translations, rotations, and reflections on two-dimensional figures using coordinates.